This tutorial explains various ways to create sample data in python using libraries like pandas and numpy for practice.
1. Enter Data Manually in Editor Window
The first step is to load pandas package and use DataFrame function
import pandas as pd
data = pd.DataFrame({"Name" : ["John","Deep","Julia","Kate","Sandy"],
                     "MonthSales" : [25,30,35,40,45]})
Output
    Name  MonthSales
0   John          25
1   Deep          30
2  Julia          35
3   Kate          40
4  Sandy          45
Note : Character values should be defined in single or double quotes.
If you notice the syntax of pandas dataframe, columns and row values are defined in dictionary. If you understand the concept of dictionary, you wouldn’t need to mug up where to add { } and [ ].
Syntax of Dataframe :
d = {"Name" : ["John","Deep","Julia","Kate","Sandy"],
                     "MonthSales" : [25,30,35,40,45]}
pd.DataFrame(d)
2. Read Data from Clipboard
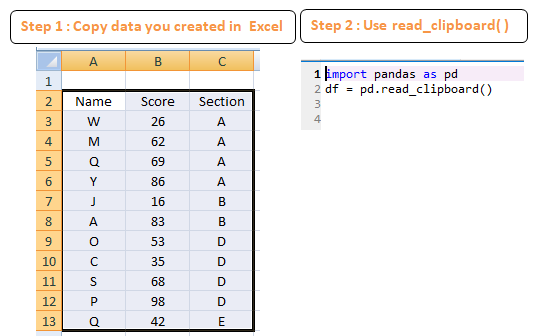
In general, MS Excel is the favorite tool of analysts for creating sample or dummy data. Analysts generally prefer entering data in Excel and then pasting it to Python for creating data frame. In pandas, there is an option to import data from clipboard (i.e. copied data) using read_clipboard( ) function from pandas package.

import pandas as pd
df = pd.read_clipboard()
Output
   Name  Score Section
0     W     26       A
1     M     62       A
2     Q     69       A
3     Y     86       A
4     J     16       B
5     A     83       B
6     O     53       D
7     C     35       D
8     S     68       D
9     P     98       D
10    Q     42       E
3. Entering Data With Delimiter
We can input data in editor window with delimiter or separator. We can use any separator – comma, space, tab etc.
import pandas as pd
from io import StringIO
text = """
Name,Score,Section
W,26,A
M,62,A
Q,69,A
"""
df =pd.read_csv(StringIO(text))import pandas as pd
from io import StringIO
text = """
Name Score Section
W 26 A
M 62 A
Q 69 A
"""
df =pd.read_csv(StringIO(text), sep="\\s+")\\s+ means one or more space as a separator at time of reading data.
Output
  Name  Score Section
0    W     26       A
1    M     62       A
2    Q     69       A
4. Prepare Data using sequence of numeric and character values
Let’s import two popular python packages for this task – string and numpy. The package string is used to generate series of alphabets. Whereas numpy package is used to generate sequence of numbers incremented by a specific value.
import pandas as pd
import string
import numpy as np
data2 = pd.DataFrame({"A": np.arange(1,10,2),
                     "B" : list(string.ascii_lowercase)[0:5],
                     })
Output
   A  B
0  1  a
1  3  b
2  5  c
3  7  d
4  9  e
Explanation
np.arange(1,10,2)tells python to generate values between 1 and 10, incremented by 2.
2.string.ascii_lowercase returns abcdefghijklmnopqrstuvwxyz. list(string.ascii_lowercase)[0:5] is used to pick first 5 letters.
5. Generate Random Data
In numpy, there are many functions to generate random values. The two most popular random functions are random.randint( ) and random.normal( )
import pandas as pd
import numpy as np
np.random.seed(1)
data3 = pd.DataFrame({"C" : np.random.randint(low=1, high=100, size=10),
                     "D"  : np.random.normal(0.0, 1.0, size=10)
                     })
Output
    C         D
0  38 -0.528172
1  13 -1.072969
2  73  0.865408
3  10 -2.301539
4  76  1.744812
5   6 -0.761207
6  80  0.319039
7  65 -0.249370
8  17  1.462108
9   2 -2.060141
Explanation
np.random.seed(1) tells python to generate same random values with this seed when you run it next time.
np.random.randint(low=1, high=100, size=10) returns 10 random values between 1 and 100. np.random.normal(0.0, 1.0, size=10) returns 10 random values following standard normal distribution having mean 0 and standard deviation 1.
Check mean and standard deviation of normal distribution
np.round(np.std(np.random.normal(0.0, 1.0, size=1000)))
np.round(np.mean(np.random.normal(0.0,1.0, size=1000)))
Generate more than 1 random variable with a single function
np.random.randn(6, 4) tells Python to generate 6 random values from the “standard normal distribution” in 4 columns
np.random.seed(12)
df = pd.DataFrame(np.random.randn(6, 4),
   index=list('abcdef'), columns=list('ABCD'))
Output
	A         B         C         D
a  0.472986 -0.681426  0.242439 -1.700736
b  0.753143 -1.534721  0.005127 -0.120228
c -0.806982  2.871819 -0.597823  0.472457
d  1.095956 -1.215169  1.342356 -0.122150
e  1.012515 -0.913869 -1.029530  1.209796
f  0.501872  0.138846  0.640761  0.527333
6. Create Categorical Variables
In this step, we will create two types of categorical variables :
- Categories ranging from 1 to 4
- Binary variable (0 / 1)
import pandas as pd
import numpy as np
np.random.seed(1)
data4 =pd.DataFrame({"X"  : np.random.choice(range(1,5), 20, replace=True),
                     "X1" : np.where(np.random.normal(0.0, 1.0, size=20)<=0,0,1)})
Output
    X  X1
0   2   1
1   4   0
2   1   1
3   1   0
4   4   1
5   2   0
6   4   0
7   2   0
8   4   1
9   1   0
10  1   0
11  2   0
12  1   1
13  4   1
14  2   0
15  1   1
16  3   1
17  2   1
18  3   1
19  1   0
Explanation
np.random.choice(range(1,5), 20, replace=True)means generating 20 values from 1 to 4 (excluding 5) with replacement (i.e. repeated values).np.where(np.random.normal(size=20)<=0,0,1)implies if random value is either zero or negative, make it 0. Otherwise 1. np.where( ) is used to construct IF-ELSE statement in python.
Like R’s factor( ) function, you can define variable(s) as categorical variables. See the code below.
data4.X  = data4.X.astype("category")
data4.X1 = data4.X1.astype("category")
7. Import CSV or Excel File
Using pandas functions read_csv( ) and read_excel( ) functions, you can read data from excel or CSV to Python. You can either use forward slash (/) or double backward slash (\\) while specifying file location.
import pandas as pd
mydata= pd.read_csv("samplefile.csv")
mydata = pd.read_excel("samplefile.xlsx")